TrendTracker Update - November 15, 2016
By Art Raymond
Will The Fed Raise Rates?
The November 6th Employment Situation Report covering the month of October was interpreted as a clear signal that the economy has strengthened enough to enable the Fed to raise interest rates for the first time since 2008. Positive signs from recent labor market reports include:
- The headline unemployment rate (formally known as U3) remained at 5.0 percent, down 0.7 points over the past year – A truer measure of labor market health called U6, which includes those not looking for a job and those working part time due to the lack of full-time employment, fell to 9.8 percent, down from 11.5 percent last October and the lowest level since May 2008.
- The average workweek for production workers edged up by 0.1 hours to 33.7 hours.
- The average hourly earnings for all workers rose by $0.09 cents to $25.20, up by 2.5 percent over the last year and the best annual increase since July 2008.
- Initial jobless claims held unchanged, and continuing claims are down for the week of 11/7 as the number of lay-offs has remained flat for the 12 months ending in September.
- Job openings at 5.5 million were little changed in September and have increased during the 12 months ending in September.
Signs of continued weakness in the labor market include:
- 7.9 million workers cannot find a job, a high number following six years of so-called recovery.
- The civilian labor force participation rate was unchanged at 62.4 percent, down from 62.8 percent a year ago and 66.2 percent in October 2006.
- The employment-population ratio remained at 59.3 percent showing little movement over the past twelve months and compared to 63.3 percent in October 2006.
- Job openings declined 5.3 percent in August from the July high for this recovery.
- Yes, the situation for those working is brighter. But too few are carrying the water for too many.
GDP Slows
Third quarter GDP came in up an annualized 1.5 percent following second quarter’s 3.9 percent. That performance is below the average growth of 1.7 percent over the prior four quarters. The deceleration in 3Q primarily reflected a downturn across a broad group of measures: private inventory investment, exports, nonresidential fixed investment, personal consumption expenditures, state/local government spending, and residential fixed investment.
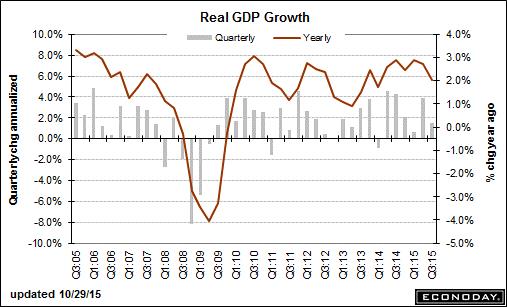
From 2000 to the present, GDP growth averaged 1.7 percent compared to 3.5 percent from 1950 to 2000. Since the 2009 bottom, GDP as illustrated in the chart above has grown only 2 percent annually.
What does that weak performance mean to the average citizen? Economist John Cochrane offered this answer in his blog. Since 1952 real GDP has risen from $16,000 to over $50,000 today in constant 2009 dollars. If the economy had grown at today’s 2 percent rate since 1950, per capita annual GDP in 2000 would have risen to only $23,000 – a huge reduction in standard of living. Clearly it’s imperative to implement economic policies that get us growing at historic rates again. Without higher growth, the economy will never create jobs for those 7.9 million currently seeking work.
What About Manufacturing?
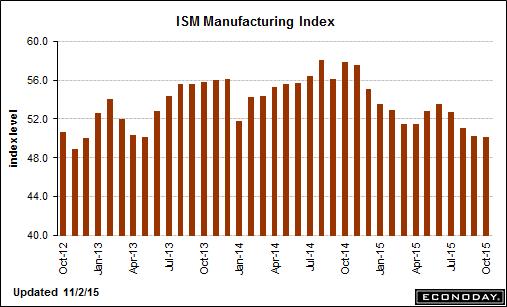
The ISM Manufacturing Index fell to 50.1 in October, its weakest since May 2013 and barely above a score below 50 that would mark contraction. While new orders were up nearly 2 points to 52.9, backlog remains mired in contraction at 42.5, along with new export orders at 47.5 for the fifth consecutive month. More importantly, manufacturing employment fell almost 3 points to 47.6 after five months of expansion, and is at the lowest level since August 2009.
With Eurozone GDP running at only 1.6 percent this year combined with weakness around the world and a strong US$, the run of 34 consecutive months of manufacturing expansion may be in jeopardy. Note that an interest rate increase will further strengthen the US$. Sales of capital equipment have also been negatively impacted by the recent decline in the oil exploration.
While manufacturing employment peaked in 1979 at 19.5 million workers and only accounts for 9 percent of the work force, the sector still matters to the U.S. economy. Many workers like truck drivers who are not counted as production employees are part of the sector’s value chain. In total the ‘goods producing’ part of our economy represents 30 percent of GDP. Outsourcing of services such as payroll processing and distribution combined with healthy productivity gains mean fewer workers are directly involved in production.
Car Sales Support the Retail Sector
Lower gas prices mean less sales at gasoline stations. Those sales were down nearly 20 percent year-on-year and 3.2 percent in September alone.This weakness has hidden strong performances in other retail sectors. Excluding the drop in sales at gasoline stations, retail sales would be up a solid 4.9 percent over the last 12 months versus the actual 2.4 percent annual growth.
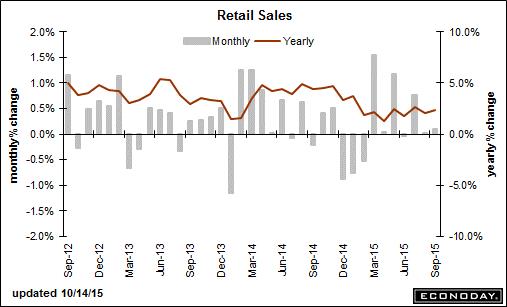
In September consumers spent the savings from lower gas prices on new cars (up 8.8 percent) and restaurant meals (up 7.9 percent). Car makers sold 1.46 million light vehicles in October, the third consecutive month of solid growth, and are on track to sell over 18 million in 2015, the highest rate in history. With interest rates on car loans and an average financing term now at nearly 68 months, monthly payments are averaging only slightly higher than in 2005. Plus over 28 percent of cars are leased. With car loan balances in 3Q2015 at $968 billion and 39 percent of borrowers with nonprime or subprime credit scores, one can wonder if the consumer can keep car sales humming at historic rates.
Housing Produces Mixed Headlines
September housing starts jumped 6.5 percent driven by an 18.3 percent rise in multi-family construction to an annual rate of 1.206 million. This strong performance was offset by a significant drop in permits, which declined by 5.0 percent led by a 12.1 percent fall in the multi-family sector. The downturn in permits hints at slower actual construction in the near term.
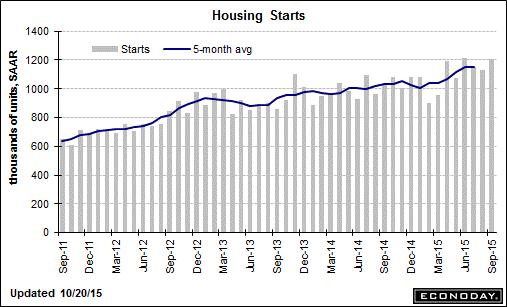
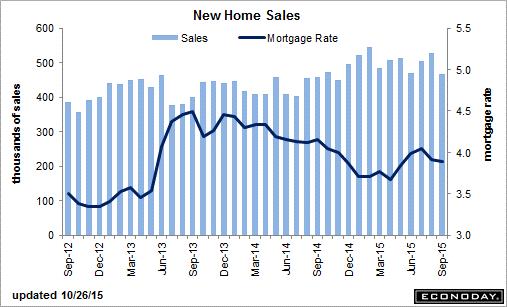
Furthering this concern about the outlook for this important sector of the economy is the 11.5 percent drop in September new home sales to an annual rate of 468,000, the lowest since last November. That slowdown caused a surge in the supply of new homes on the market to 5.8 months from 4.9 months in August. Equilibrium between supply and demand is considered to be 6.0 months of supply.
One culprit is believed to be higher prices as the median jumped 2.7 percent in September, up 13.5 percent over a year ago. Affordability is critical especially among first-time home buyers.
The bright spot in housing is existing home sales, which rebounded by 4.7 percent in September following a 5.0 percent decline in August. The annual sales rate of 5.55 million is the second best performance of the recovery and is 8.8 percent above last September.
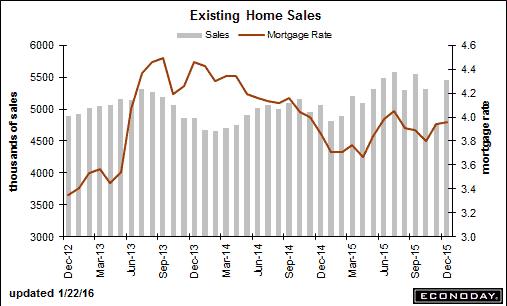
Unlike new home prices, the median price for existing homes fell 2.9 percent versus August and only 6.1 percent above the same month last year. At 4.8 months in September compared with 5.4 months a year ago, supply is thin. The lower inventory of homes for sale should result in firmer pricing.
Purchases of homes by first-time buyers is running at a historically low rate. In an early November press release, the National Association of Realtors reported that the share of homes sold to first-time buyers declined to 32 percent, the lowest level in almost 30 years, versus the historical average of 40 percent. As reported in the August TrendTracker Update, without healthy sales of so-called starter homes, current owners cannot trade up to a larger home thus reducing demand for mid- and higher-priced houses. The problem is affordability and the creditworthiness of potential new buyers who have incurred large student debt. In addition, renters who are paying high rents have difficulty saving money for a down payment.
Bottom Line: Based on the most recent jobs report, the probability of the Fed pushing interest rates higher in December jumped from below 30 percent in mid-October to 70 percent. For months, Fed officials have repeated that an upward move in their benchmark rate will require a “real and sustainable improvement in the labor market”. But with GDP growth bumping along well below the historic norm, the labor force participation rate running at 1977 levels, manufacturing falling towards negative territory, and home construction showing signs of weakness, one can easily argue that a trend that meets the Fed’s requirements has not been established. Let’s hope that current economic performance is not seen by the Fed as the new normal...