TrendTracker Update - May 16, 2016
By Art Raymond
Stuck in Low Gear
For the first quarter of 2016, the U.S. Gross Domestic Product, the broadest measure of economic output, rose an anemic 0.5 percent. That performance was the worst in two years and has extended the period of sub-three percent growth into its eleventh year. Such a period of virtual stagnation has not occurred since the 1930s.
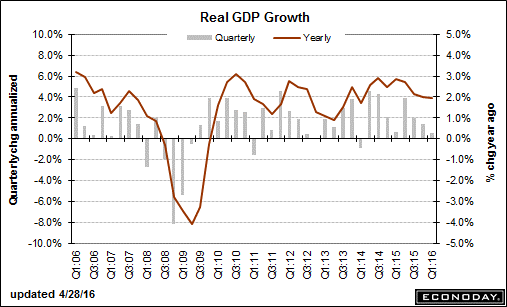
The recent weakness was driven by a 5.9 percent drop in business investment, highlighted by weak spending in the energy sector. Impacted by a relatively strong dollar, exports were also negative for a second quarter. This poor performance came without the excuse of the severe weather experienced in 1Q2015.
Accompanying the poor GDP picture was a softening labor market in April. While the headline unemployment rate held steady at 5 percent, the size of the work force, as measured by the labor participation rate, dropped by 0.2 to 62.8 percent of the population aged 16 and older. The employment-to-population ratio came in at 59.7 percent, also down by 0.2 in March.
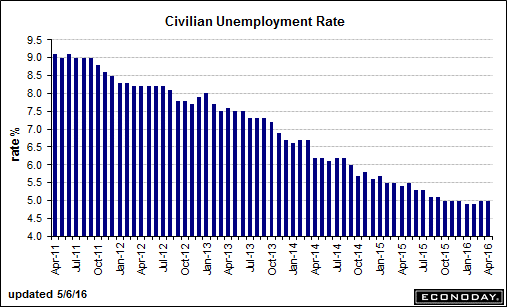
The total unemployed rate, called U6, dropped to 9.7 percent, down from 10.8 percent a year ago. That metric includes 6 million workers who are employed part time but prefer a full-time job.
Average hourly earnings rose by 0.3 percent and are up 2.5 percent from a year ago. Also driving bigger paychecks was a 0.1 hour increase in the average work week to 34.5 hours, up 2.0 percent over the last 12 months.
April saw the hiring of 160,000 workers bringing the year-to-date monthly average to 192,000. That’s down from the average of 229,000 jobs added monthly in 2015. While slower than last year, recent new jobs numbers remain well above the 100,000 jobs per month needed to absorb new entrants to the labor market.
Historically a strong labor market is pulled along by healthy economic growth. But recently the rate of hiring has been out of sync with GDP. During the year ending with 1Q2016, employment grew by over 2.8 million jobs. At the same time GDP grew only 1.9 percent. Historically such job growth has been driven by a mid-three percent GDP growth rate.
That combination of slow GDP and a healthy job market can only be explained by a decline in labor productivity. Labor productivity in 1Q2016 dropped a full percent as a result of a 0.4 percent increase in output generated by 1.5 percent more hours worked. With wage costs up 3 percent and productivity down 1 percent, unit labor cost rose by 4.1 percent.
Productivity across all non-farm sectors rose a healthy 2.6 percent annually from 2000 through 2007. Since then that metric has averaged a measly 1.2 percent. Increasing productivity translates into more goods and services per unit of work and also means more goods and services can be consumed for a given amount of work. Thus productivity is the primary driver of living standards.
Two elements contribute to rising labor productivity: investment in (a) improved labor skills and (b) labor-saving equipment. Knowing that, it’s no wonder we are stuck in a severe output gap operating well below our potential. Labor skills have undoubtedly deteriorated since the last downturn, and businesses are not installing labor-efficient equipment.
One contributor to the current malaise is out-of-control regulation. Yes, we must live in an equitable rules-based society. But in recent years the federal government has published 80,000+ pages of new regulations, and that’s just the feds. These directives impose $1.9 trillion of annual, mostly non-productive costs to our economy, according to the Competitive Enterprise Institute. Combine that number with the $3.9 trillion of federal spending and pretty soon you are talking about serious money.
Much of this compliance burden falls on the small businesses that create a significant share of the new jobs in our economy, not to mention the new ideas that drive our standard of living.
How are the other key TrendTracker metrics performing, in the face of tepid GDP growth?
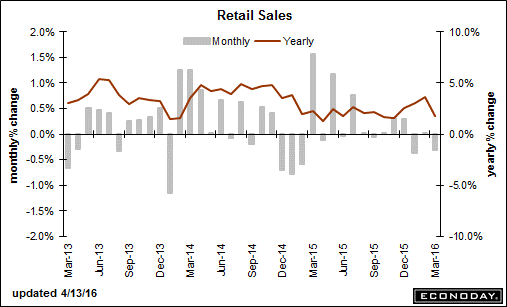
Retail Sales: Sales to consumers fell a worrisome 0.3 percent in March, led by the largest drop in vehicle sales since February 2015 and restaurant spending, which fell 0.8 percent. Up till now, retail has been supported by relatively strong job creation, with more people earning a paycheck. Knowing the jobs market softened in April, economists worry that the consumer, who accounts for two-thirds of the U.S. economy, can keep us out of negative territory. While one month’s data does not make a trend, keep your eye on the consumer when Retail Sales is reported on May 13.
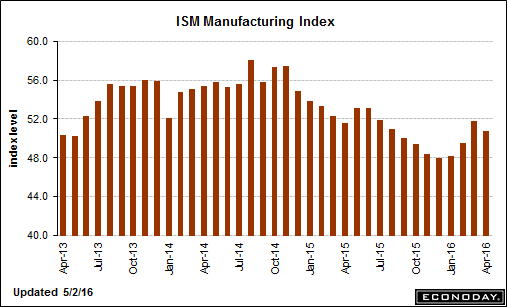
Manufacturing: The February TrendTracker Update noted that the ISM Manufacturing Index had reported four consecutive months below 50, a sign that historically has meant weaker job creation. That negative trend was broken in March with a solid jump to 51.8 that was followed with a 50.8 in April. New orders in April came in at 55.8. Backlogs are still rising at 50.5 and, when combined with March’s 51, display the best two-month performance since December 2014.
All in all, April’s ISM is a reason for optimism in the manufacturing sector, especially with the U.S. dollar falling 4.5 percent this year.
Housing: Following on a reasonably healthy housing market in 2015, this year’s performance in this important sector is disappointing. Last year Housing Starts rose by a solid 6.4 percent to an annualized 1.149 million. New Home Sales increased by a strong 14.7 percent to 501,000. Existing Home Sales grew by 7.7 percent to 5.46 million.
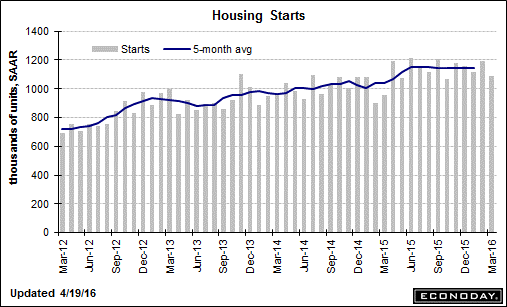
By contrast, in March Starts fell 8.8 percent to 1.089 million. Weakness was equally shared by both the single-family and multi-family categories. The flat five-month moving average since last July, shown by the blue line in the above chart shows little, if any, momentum going into the critical spring season for builders. Keep your eyes on the May 17 Housing Starts report for a positive sign in this important sector.
March New Home Sales came in at a 511,000 annualized rate, following on February’s 519,000, which is among the best months’ performances since 2008. Builders’ inventories of homes for sale improved to 246,000, with supply relative to sales rising to 5.8 months. Housing experts consider a six-month supply as consistent with a balanced market.
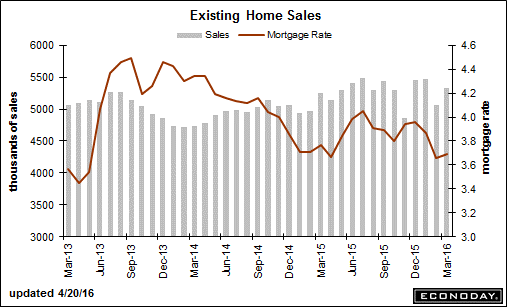
Existing Home Sales in March ran at an annualized rate of 5.330 million, down 2.4 percent since year-end. Year-on-year sales of single family homes are up by 2.6 percent. Condo sales dropped by 6.6 percent. Like the inventory of new homes, the supply of existing homes for sale at 4.5 months of sales is below the stock considered a balanced market. However the 5.7 percent rise in median selling price is pulling more homes into the market.
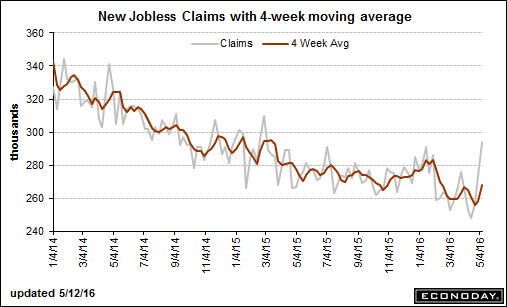
Jobless Claims: During the week of April 16, 247,000 individuals filed for Initial Jobless Claims. That number was the lowest since November 1973 when the labor market was much smaller. Since then, Initial Claims has taken a troubling turn for the worse by jumping to 294,000. That’s the highest level since February 28, 2015. Thankfully the number of weeks with claims below 300,000 reached 62, the longest such streak since 1973. In any case, the direction of this important metric bears close watching. This metric is reported every Thursday.
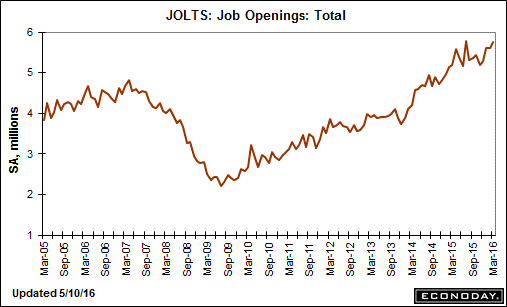
Job Openings: An upbeat indicator of economic strength is the March job openings number of 5.757 million, up from 5.608 in February. However, these data are always stale given the lag between their occurrence and release. With the more timely Initial Claims report flashing a rise in lay-offs, the optimism generated from this Job Openings report may be ephemeral.
Bottom Line: Our economy has inarguably underperformed since the end of the last recession in June 2009. Few can debate that a stubborn output gap exists with actual output falling below its full capacity potential. Such a persistent output gap has three consequences:
- Slack in the labor market lingers: Witness the number of potential job holders who remain on the sidelines.
- Jobless workers’ skills atrophy and less capital is invested in assets that improve efficiency: Witness the number of workers unemployed for six months or more, plus the declines in labor productivity and business investment.
- Fewer wage earners means lower tax revenues, while support of the unemployed increases government deficits: Witness our inability to maintain critical infrastructure and provide needed services.
Being Republican or Democrat, conservative or liberal, does not matter. We’re all in this boat together. Closing the gap requires both monetary and fiscal policies that grow the economic pie and return us to our historic potential. Only then will a rising tide lift all boats.