Management / Strategy
TrendTracker Update – May 15, 2015
By Art Raymond
When marking the official end of the Great Recession as June 2009, economic experts reminded us that date was only the beginning of a recovery, not an announcement that the economy was back at full speed. Now six years later, we know that downturn, the longest since WW2, and the policies rendered to combat it, continue to exert a negative influence on our economic health. So, how are the key elements of the U.S. economy performing?
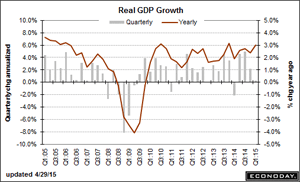
General Economic Activity – First quarter Gross Domestic Product came in at 0.2 percent following a weak 2.2 percent in 4Q2014. Much of that softness was attributed to bad weather, which hammered both business and consumer spending, and a strong dollar, which hurt exports. While the chart shows the volatility of quarterly performance, the more stable year-on-year numbers show the economy averaging well below an acceptable level of 3 to 3.5 percent, since June 2009.
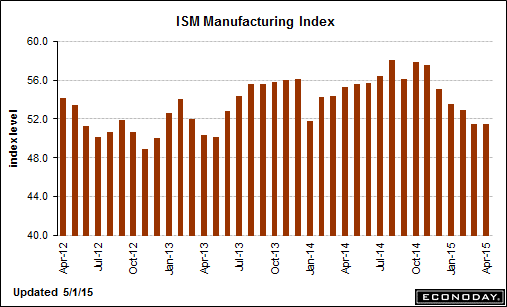
Manufacturing – The ISM Manufacturing Index reports the general direction of activity – positive or negative – in the manufacturing economy. The April report came in at 51.5, flat with March, 1.4 points down from February, and at its lowest level since May 2013. The primary culprit was lower manufacturing employment, which offset gains in new orders, exports, and production. The chart shows the trend line sliding toward 50, below which this important sector is contracting.
Housing – This important sector has yet to pull its weight in leading this recovery upward:
- March Housing Starts rebounded 2 percent, following a 15.3 percent decline in February. At 0.926 million annually, starts were down 2.5 percent year-on-year.
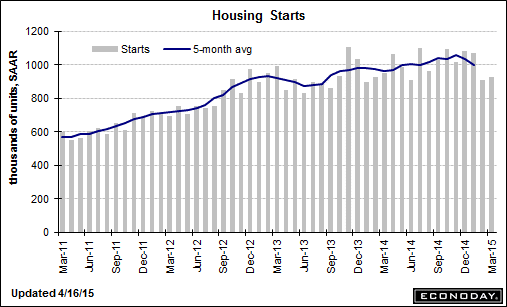
At less than a million starts, the housing market remains well below the 2.06 million homes started in 2005, and the 1.6 million annual starts that experts claim creates a sound equilibrium between supply and demand.
- After a healthy surge in late 2014/early 2015, New Home Sales declined by 11.4 percent in March. Yet over the last year this metric jumped a healthy 19.4 percent.
- The bright spot for this sector was Existing Home Sales which rose 6.1 percent in March, the highest gain since December 2010.
Home prices in general are soaring across the U.S. The median price of a single-family home rose by 7.4 percent in the first quarter versus a year ago. According to the May 12 Wall Street Journal, 51 metropolitan areas posted double-digit price increases in the first quarter, versus only 24 in 4Q2014. Higher prices reflect the decrease in the supply of homes on the market from 4.9 months a year ago, to 4.6 months in 1Q. Experts suggest that 6 to 7 months of supply creates a sound equilibrium between supply and demand.
Employment – The headline unemployment rate fell to 5.4 percent in April with employers adding 223,000 jobs, up from only 85,000 in March. The jobless rate is now at its lowest level since mid-2008. A broader measure that accounts for those who are under-employed fell to 10.8 percent, down from 12.3 percent a year ago.
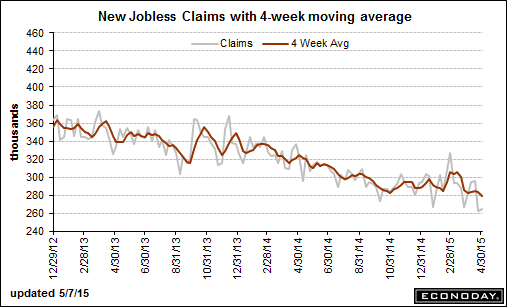
The four-week moving average of Initial Jobless Claims, a proven indicator of the direction of the economy, came in at a 15-year low.
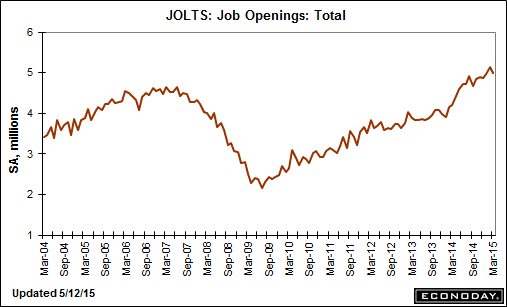
All good news. Yet the JOLTS Report, which tracks available job openings, fell below 5 million in March, down 2.9 percent. And the Labor Force Participation Rate, which shows the percentage of 25 to 54 year olds at work or seeking a job, only rose to 62.8 percent, near the lowest level since the late 1970s. Add the decline in the average work week for hourly workers and a slow 2 percent annual rise in wages, and the result at best is a stagnant standard of living for many Americans.
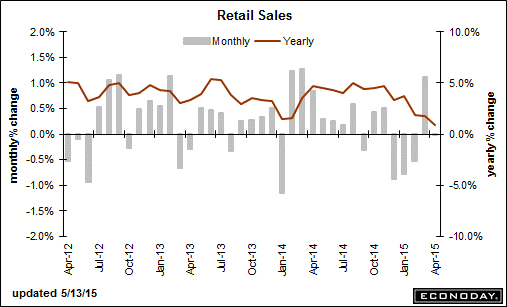
Consumer Demand – Retail Sales, accounting for about two-thirds of GDP, were unchanged in April. Weakness was seen in final sales of all sectors, with motor vehicles down 0.4 percent, department stores down 2.2 percent, and furniture off 0.9 percent.
Clearly, economic growth here in the U.S. is lukewarm at best. GDP growth, the broadest measure of aggregate economic activity, is running under 3 percent. Housing, historically an early driver of growth, is running at two-thirds or so of a healthy rate. While unemployment has fallen to a seven-year low, millions are still seeking full-time jobs. As a direct result, consumer spending continues to be flat.
Two other factors are having an impact on our economy.
- On the negative side, the stronger dollar is hurting exports, which was the heaviest drag on first quarter GDP.
- On the plus side, lower energy prices are reducing the cost of doing business and giving the consumer more disposable cash to spend.
Wild cards are held by the Federal Reserve and to a lesser extent the European Central Bank, which has initiated a quantitative easing operation to add fuel to the economies of its members. The flooding of the EU with trillions of euros will no doubt boost demand there, as the Fed’s QE program did here.
But potentially more critical is the Fed’s plan for interest rates. Is the U.S. economy strong enough to weather an increase in rates? Pessimists believe our tepid economy will stall and decline. On the other hand, optimists note that the U.S. has historically prospered in times of higher rates. Our average bank lending rate since 1950 is 6.77 percent, nearly twice the current level. What is needed most is confidence, a belief that these trillions of new funds will eventually fuel a much stronger global economy and that we can withstand any negative side effects.
Only time will tell. In many ways our economy is in uncharted waters. Stay tuned. It’s going to be an interesting ride…