Management / Strategy
TrendTracker Update - Febrary 15, 2016
By Art Raymond
Recession On The Horizon?
With industrial production falling for 10 of the last 12 months, corporate profits declining by five percent or more, and the stock market plunging into correction territory, talk of a recession is once again in the news. Before we accept the talking heads’ reporting as fact, let’s look at the definition of a recession:
• The official arbiter of the beginning and end of recessions is the National Bureau of Economic Research (NBER). That august body defines a recession as “a significant decline in activity spread across the economy lasting more than a few months visible in industrial production, employment, real income and wholesale/retail trade.” No fixed rules stipulate the weight attributed to each of those four measures, thus the NBER’s process for dating recessions is somewhat a matter of conjecture and is debated long after the economy changes direction.
• A widely accepted yet unofficial definition is two consecutive quarters of negative GDP. While that meaning is easier to pinpoint than the NBER’s, it’s also imprecise since revisions to GDP data occur regularly for three years.
So how do we react to headlines claiming a recession is just over the horizon? One suggestion is to look first at two measures that have excellent track records as predictors of bad economic times:
1. Relative Interest Rates: Central bankers pay close attention to the relationship between interest rates and maturity dates. The yield curve, a graphical representation of this relationship, plots interest rates at a set point in time of bonds having equal credit quality but differing maturity dates. The example below shows the current yields in early February on U.S. Treasury debt of various maturities where near-term interest rates are lower than longer maturities.
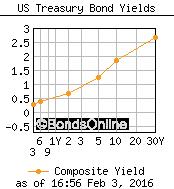
The shape of this curve is considered normal because investors receive higher returns on longer maturities due to greater risk. When shorter term yields exceed those on longer maturities the yield curve is inverted. An inverted yield curve is among the best predictors of recession. Since World War 2 in the U.S., no recession has occurred until the curve has inverted. With short- term rates currently below 0.75 percent, it’s unlikely that long-term rates can fall far enough to invert the curve.
2. Jobless Claims: TrendTracker has long reported the status of initial jobless claims for one reason: that metric is among the best predictors of both the beginning and end of U.S. recessions. Historically claims bottom out a few months before a recession commences. Although claims for the first week of February fell, the chart below shows the possible formation of a longer-term trend upwards in the number of claims since last fall.
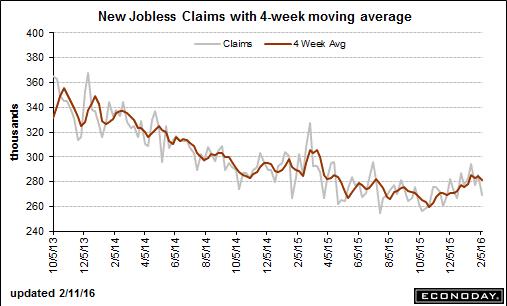
Watch closely for the direction of future initial jobless claims.
So while the risk of a recession based on jobless claims is somewhat higher, TrendTracker currently believes the U.S. economy will bump along with above-zero growth. In doing so, we will avoid two consecutive quarters of negative growth and thus remain out of recession territory.
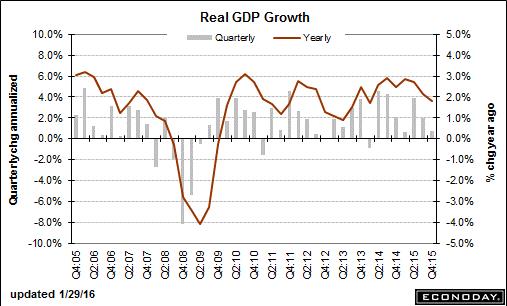
Gross Domestic Product: The above conclusion is not, however, to say that the U.S. is in great economic shape. With 4Q2015 GDP growth coming in at 0.7 percent, we have experienced 10 straight years of growth below three percent. Such a period of virtual stagnation has not occurred since the 1930s.
Both the consumer and business sectors of the economy weakened in 4Q2015:
• Retail sales declined into negative territory, and full-year performance came in up only 2.1 percent – the lowest gain since 2009. Savings from lower gas prices, now below $2 per gallon in most areas, are not fully being spent on goods and services.
• Companies built less inventory and spent less on capital investment. The stronger dollar is proving to be a head wind for those who export.
With GDP performance being a key to defining recession, you should keep a weather eye on that important metric next reported on February 26.
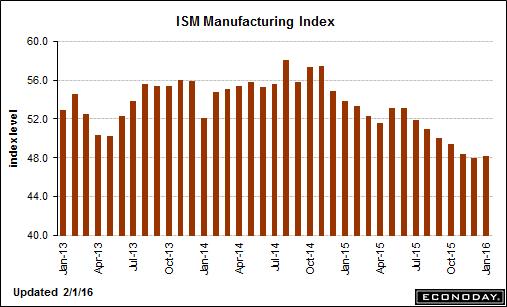
Manufacturing: Given the inclusion of industrial production data in the NBER’s determination of the business cycle, TrendTracker watches the ISM Manufacturing Index. At 48.2, that metric too is flashing a negative sign by remaining below 50 for the fourth consecutive month. The ISM has been below 50 for four or more months six times over the past 30 years. In each such period, job growth has declined in the next 12 months. More on the labor market below…
Housing: The housing sector turned in a respectable performance in 2015. Housing Starts in December fell 2.5 percent to an annualized rate of 1.149 million, although for the full year this metric grew by a healthy 6.4 percent. Put in context, starts are up 93 percent since the last bottom in 2009 but a long way from the 2.068 million level reached in 2005 and the 1.55 million that experts consider a healthy equilibrium between supply and demand.
New Home Sales provided a year-end boost to the economy by finishing 10.8 percent higher than November. For the full year this metric rose by a strong 14.7 percent.
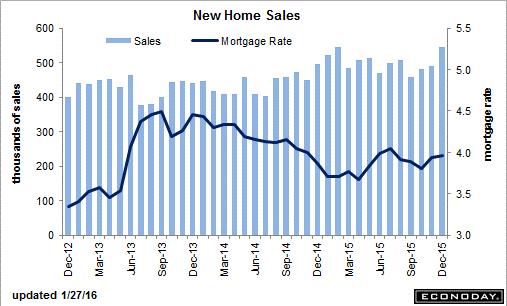
One positive sign for flooring mills, cabinet makers, and the like is the continuing affection of American homebuyers for big houses. The average-sized house built in 2015 contained 2,720 square feet, up from 2,660 square feet the prior year. That’s up from 2,360 square feet in the recession year 2008.
However, with larger size comes higher prices. The average price of a new home for sale last year jumped to $351,000, up a staggering $100,000 from 2009. As a result, affordability has become an issue for first-time buyers whose share of the market fell to 32 percent, the lowest level in three decades. Builders are simply not putting up smaller, less pricey homes. Rather in many neighborhoods, builders are tearing down $300,000 homes and replacing them with houses priced at $1 million or more.
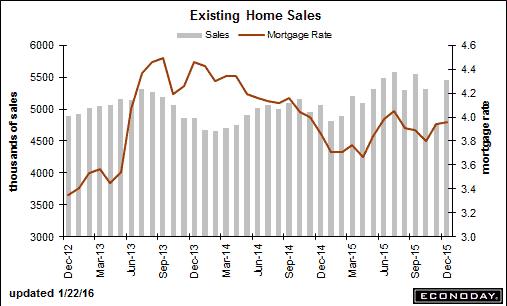
Existing Home Sales also contributed positively in 2015 with the December number jumping 14.7 percent. Full-year sales finished the year up 7.7 percent. Experts warn, however, that future sales may be slowed by the inventory of homes for sale now at an eleven-year low.
Employment: 151,000 jobs were created in January vs. 262,000 in December, and the headline unemployment level fell 0.1 points to 4.9 percent. Many economists took the accompanying news that average hourly earnings increased by 0.5 percent and the number of hours worked per week rose by 0.1 hours last month as signs that the economy is nearing full employment. You may quibble with that conclusion knowing that the:
• Labor Participation Rate remains within 0.1 point of its 38-year low and well below its most recent high reached in April 2000.
• U6 Unemployment Rate, a truer measure of labor market health which includes those not looking for a job and those working part time due to the lack of full-time employment, remains near double digits at 9.9 percent and well above the 6.8 percent in October 2000.
Also troubling are the three percent drop in Labor Productivity and resulting 4.5 percent rise in Unit Labor Costs in 4Q2015. A share of that cost increase may be attributable to the mandated rises in minimum wage rates in 14 states. Whatever the cause, higher labor costs without solid productivity bode poorly for future increases in wage rates.
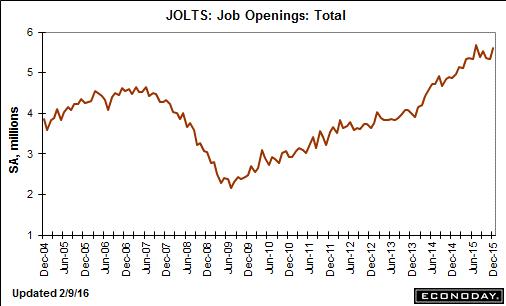
In positive news, companies continue to seek more workers. Job Openings jumped in December to
5.607 million, the second highest rate in history and up nearly 5 percent versus the prior month. Confirming the downward trend in Jobless Claims in 2015 reported above, Layoffs & Discharges fell by 11 percent during the year. During that period Quits rose by 15.6 percent, historically a sign that workers are moving up to better jobs.
With actual job creation softening in the face of higher job openings, the employment picture is confusing. Possibly employers may be struggling to hire sufficiently skilled worker. Or the job market may simply be reflecting a weaker economy. One fact is certain: with a stubbornly low participation rate and relatively high U6 unemployment rate, too many workers are carrying the water for too many sitting on the sidelines.
Bottom Line: Driven by a full-blown credit crisis, the 2008-09 recession was unlike most before it. As a result, policy makers lacked a toolbox of proven solutions to cure the problems then existing. Consequently the U.S. economy has muddled along, trapped in a severe output gap well below its potential for 78 months. Unless new policies are implemented to grow the economy and create new jobs, that recent past will become the new normal. Time is of the essence...