Management / Strategy
TrendTracker Update - August 15, 2015
By Art Raymond
Housing experts tell us that a key driver of housing demand is household formations. People graduate from school, get a job, and move into a rental home or apartment. When financially able, they purchase a house. That path has been a cornerstone of the American Dream for years. For many, however, the severe downturn in 2008 and the agonizingly slow recovery have put that dream on hold.
The 25 to 34 year olds within the millennial generation form a key demographic cohort: first- time homebuyers. Unfortunately this group has been hammered by the confluence of four circumstances: a poor job market, high student debt, rising home prices, and tight mortgage loan criteria. With little ability to save money for a down payment, many Millennials have been forced to live with their parents or to rent. In spite of an expanding population, the result was a significant drop in household formations as shown in the table below.
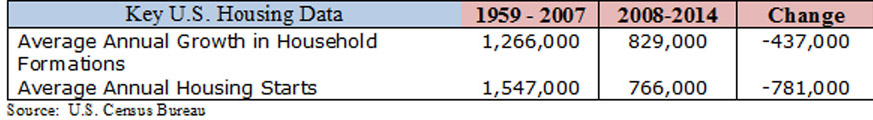
It follows then that housing starts have declined in parallel. From 1959 when data was first collected on starts through 2007, the average number of annual starts exceeded 1.5 million. In the seven years since then, this key indicator averaged less than 50 percent of that experienced over the previous 49 years. Obviously that decline translated into much lower sales of hardwood home products like cabinetry, flooring, and millwork.
The unexpected jump of two million household formations in 2014 may be providing light at the end of the nearly eight year-long tunnel. Last year starts totaled one million, a rate significantly stronger than the 727,000 average of the prior six years. Add the 1.17 million annual rate reported for June, and we finally have a positive sign in the housing market.
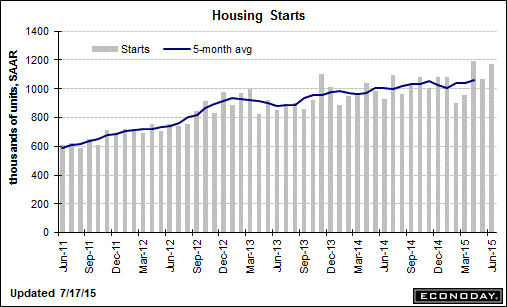
June’s gain was driven by the multi-family sector, which rose nearly 30 percent from the prior month. Builders are clearly responding to 2014’s large jump in household formations especially among younger adults. Now the challenge is reaching sufficient economic strength to enable those potential first-time homebuyers to step into ownership of single-family houses. A 2014 survey by the National Association of Realtors found that 33 percent of all homebuyers were first timers, down from an historic norm of 40 percent. That’s the lowest rate since 1987. With only 63.4 percent of Americans owning a home, the lowest level since 1965, there is a lot of room for improvement in the housing market.
The economic bottleneck keeping first-timers from buying adversely affects the entire spectrum of single-family homes. If owners of starter homes cannot sell, they cannot move up market. When that situation prevails, the market for high-end homes stagnates too. Only with higher starter home sales will we see the housing economy back fill the deficit in homes that has accrued since 2008.
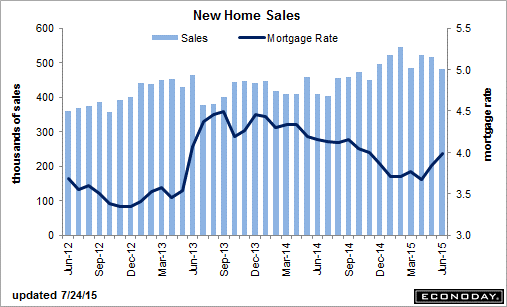
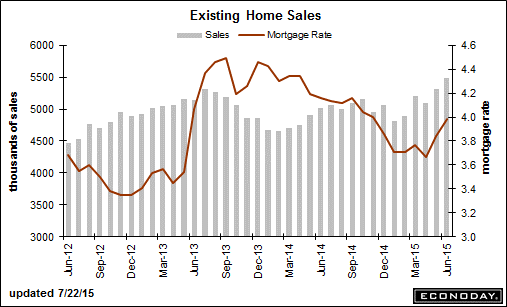
Month-to-month volatility makes searching housing metrics for a trend somewhat a guessing game. While starts were positive in June, new home sales fell by 6.8 percent, and existing home sales gained 3.2 percent. Optimists point to the gain in the supply of new homes for sale as pointing to stronger sales ahead. That inventory was 5.4 months of sales in June, up from 4.7 months in May. The larger supply on builders’ books led to a 1.8 percent softening of prices. Despite the June decline, the latest reading is 18.1 percent above the rate of new home sales in June 2014.
Existing home sales leapt to an annual rate of 5.49 million, the best performance since February 2007. Year-on-year sales are up 9.6 percent. That strength has resulted in a five-month supply this June versus 5.5 months a year ago.
What about the other key macroeconomic indicators?
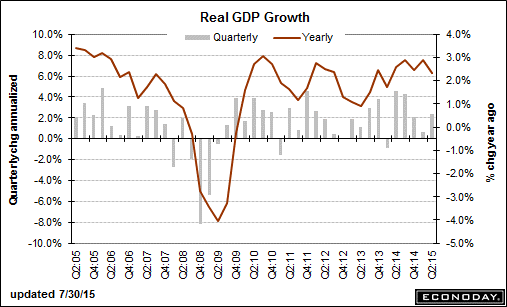
General Economic Activity – Second quarter Gross Domestic Product came in at plus 2.3 percent following a revised plus 0.6 in 1Q2015, up from the negative 0.2 percent initially reported. On the positive side were residential investment and personal spending, which was boosted by strong auto sales. Sectors on the minus side included both business and federal government spending. This latest quarter compares unfavorably with the plus 4.6 percent in 2Q2014. Economists predict that this year’s lack of positive momentum will result in a weak third quarter vs. last year’s 4.3 percent. The year-on-year numbers in the chart below clearly show that the economy is puttering along well below an acceptable level of 3 to 3.5 percent.
Manufacturing – The ISM Manufacturing Index (ISM) July number came in at a lower-than-expected 52.7, down 0.8 from the previous month, and indicates a general slowing of the economy. The primary culprits were weaknesses in manufacturing employment, backlogs, and net export orders, which offset strength in new orders and production. The weakness in export orders is attributable to the strong US$. That component of the ISM has been under 50 for four of the last six reports.
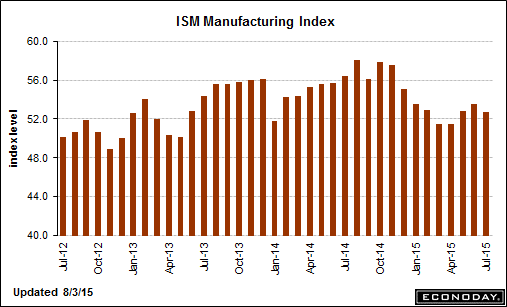
Remember that a number above 50 in this metric means growth; below 50, contraction. Note that over the years the Manufacturing Index has been a dependable coincident indicator of economic weakness. For that reason TrendTracker suggests watching the ISM for signs of further decline.
Employment – As the TrendTracker Report has continually said, housing along with the entire consumer economy will recover when a solid supply of well-paying jobs develops. Many believe that the job market is strengthening.
The headline unemployment rate in July remained at 5.3 percent, a 0.9 percentage point improvement in the last year. But remember that this metric, known as U3, does not account for people who are not seeking a job. The employed share of the working-age population was unchanged at 62.6 percent, equaling the lowest level since 1977. Many of those not looking for work have simply given up their search. A less-publicized measure of unemployment, known as U6, includes ‘marginally attached workers’ who are not actively looking for work, ‘discouraged workers’ who are no longer searching for a job, and those who have settled on a part-time job because they can’t find full-time work. Those groups contain real people living on no or limited incomes. U6 in July was 10.4 percent.
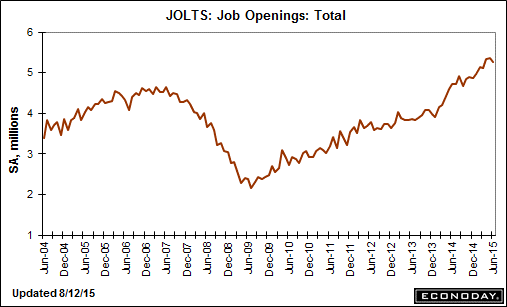
For the month of June, the JOLTS Report, which tracks available job openings new hires, and separations, points to moderate job growth at best. Job openings came in down 2 percent from May. Layoffs were up very slightly, and the quits rate remained unchanged.
Positive news from the job front included the continuing decline in initial jobless claims. All readings in the report released on August 6 are at or near historic lows. Also the average workweek rose 0.1 hour to 34.6 hours for all employees and 0.1 hour to 40.7 hours for manufacturing workers.
Bottom Line: History easily leads one to conclude that the recent low rate of homebuilding combined with a growing population has generated sizeable pent-up demand for housing. But with the general economy ambling along at less than 2 percent annual growth, one may appropriately ask: Has our economy entered a new normal of under-employment, minimal wage increases, and less than 1.5 million annual housing starts? If so, should the Federal Reserve start raising interest rates as predicted next month? As always, stay tuned…